The Basics of reporting in Jira
Reporting, based on the ability to collect relevant data, transform it, and then evaluate it, is now an integral part of each enterprise. Various reports allow a detailed analysis of Key Performance Indicators (KPIs).
Correct decisions, based on properly viewed data reflecting reality, greatly enhance the competitive ability and the efficiency of work in an enterprise. Any inability to generate the necessary reports, or their being inaccurate, can result in poor decisions and many negative impacts.
Data collection in Jira
If you already make full use of the potential of the Jira collaborative tool, in any version (see more here >> Jira Cloud vs Jira Server <<), you know that collecting relevant data is not a big problem. If you only think about using Jira in your business, it’s important for you to know that data collection is the result of high field definition flexibility, like Jira has.
In Jira it is possible to define the fields (attributes) as a certain type.
For example:
- Text box
- Numeric field
- Date field
- Selection menu (single choice select list / multiple choice select list)
- Field, in which the user or group is selected
- E-mail
- Radio buttons
- Check boxes
- URL field
- … and many, many other types
Any missing field type can be easily added from the Atlassian Marketplace. It is also not difficult to program the desired field type for specific requirements. Defining the field type simplifies input increases reporting accuracy- the user always fills in the field in the required format. One user cannot input text while another inputs a number into that field.
Another advantage of Jira is the ability to define pop-ups when collecting data. In certain steps of the process, the user only needs to input a certain subset of the data; data already in the system is added automatically. Thus, the user is not “overloaded” with the amount of data required to input, which results in increased efficiency. Only the missing data required in the given step need to be input. Nothing more.
Equally important is the ability to define mandatory and optional fields. Required fields must be filled in by users to continue the input process. This ensures that no important data is missing.
Last but not least, a lot of important data is collected automatically. As an example, we can record the status changes in a particular process or the history of the data change. Thus, a full audit in Jira is not a problem.
All the above-mentioned features of Jira guarantee the collection of quality data – the data are not redundant, are in the correct format, are complete, and are not obsolete.
“Out-of-the-box” reports in Jira
Jira, either in Core, Software or Service Desk, offers a large number of built-in reports.
If you use Jira Software with Agile application development, you can use built-in reports such as:
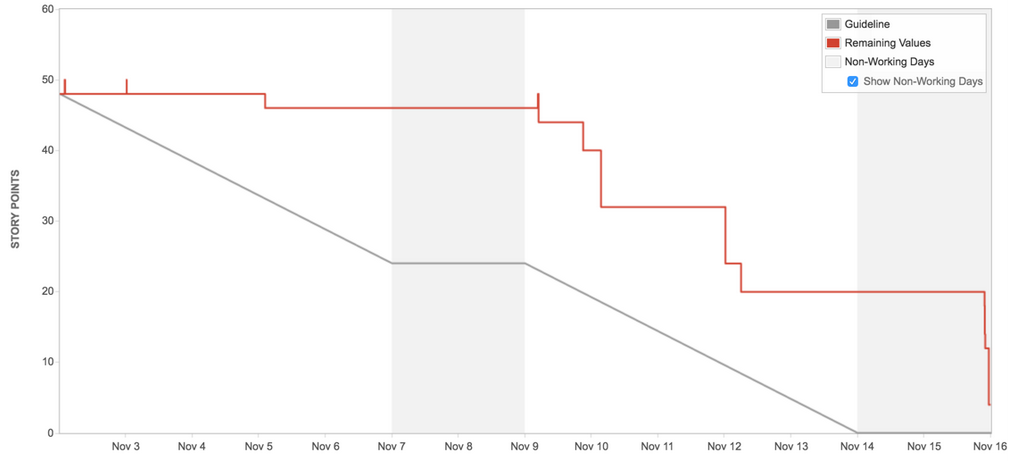
- Burndown Chart (probability of meeting the target set for a given “Sprint”, amount of residual work)
- Sprint Report (amount of completed work and the amount postponed to backlog)
- Control Chart (length of product cycle, version or sprint)
- Cumulative Flow Diagram (overview of task status in time)
- Epic Report (progress on a major work part)
- Epic Burndown (estimate of epic work being completed)
- Release Burndown (work is tracked in relation to scheduled release date for that version)
- Velocity Chart (track the development of ability to perform scheduled work in sprints)
- Version Report (tracks work in relation to planned release date for that version)
- … and many other others

Example: Burndown report, story point work remaining against time.
If you use the Jira Service Desk, for example for ITSM or for communicating with external partners and customers, you can use the following built-in reports:
- Workload (number of tickets added per agent)
- SLA goals (performance report on meeting objectives)
- Satisfaction (customer satisfaction survey in meeting their requests)
- Created vs. resolved (comparing the number of new incident tickets created vs. the number that are resolved in that time period)
- SLA met vs. breached (number of tickets which have, or have not, met the SLA target)
- … and others

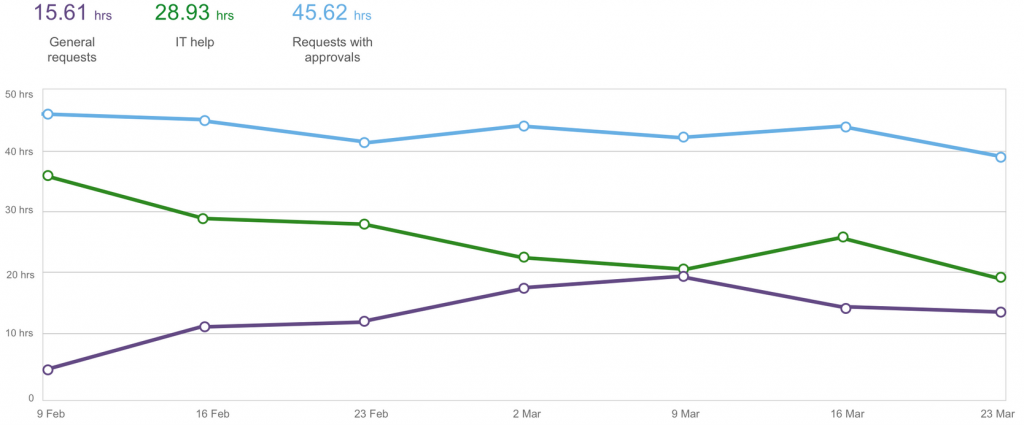
Report that shows the amount of time it takes to meet different types of tickets, with a calculated average hours per type.
If you use JIRA Core (also applicable to the Software and Service Desk) to capture any process in your business, these built-in reports are available:
- Average Age Report (age of unresolved tasks – plus average for the whole Jira project or any defined set of tasks)
- Created vs. Resolved Issues (various comparison reports in time)
- Pie Chart Report (tasks grouped according to an attribute, summed for a total with group portions shown visually)
- Recently Created Issues (overview of recently created vs solved tasks)
- Resolution Time (summary of the times needed to solve a various types of tasks)
- … and others
You can find more information about built-in reports in the official documentation:
Define your own reports in Jira
In addition to built-in reports, users can define their own views of data in Jira – using filters, dashboards, and gadgets.
An example of a simple Jira filter can be to search for all unresolved tasks from a specific project (in a user friendly Jira Query Language). JQL would look like this:
project in ("EEA SD test") AND resolution = Unresolved |
For instance, let’s say this filter returns a list of 30 tasks (all unresolved, all from EEA SD test).
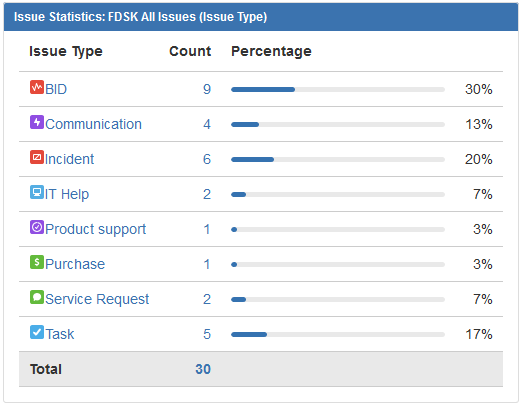
An example of a Jira gadget, which displays the result of the filter in a specified form, can be the “Issue Statistics” gadget. This gadget groups the tasks according to the selected attribute. In this case, all the filtered tasks are grouped according to their issue type.

“Issue Statistics” gadget.
Jira contains a large number of different gadgets – these can be spreadsheets, pie, line or column graphs, or other types.
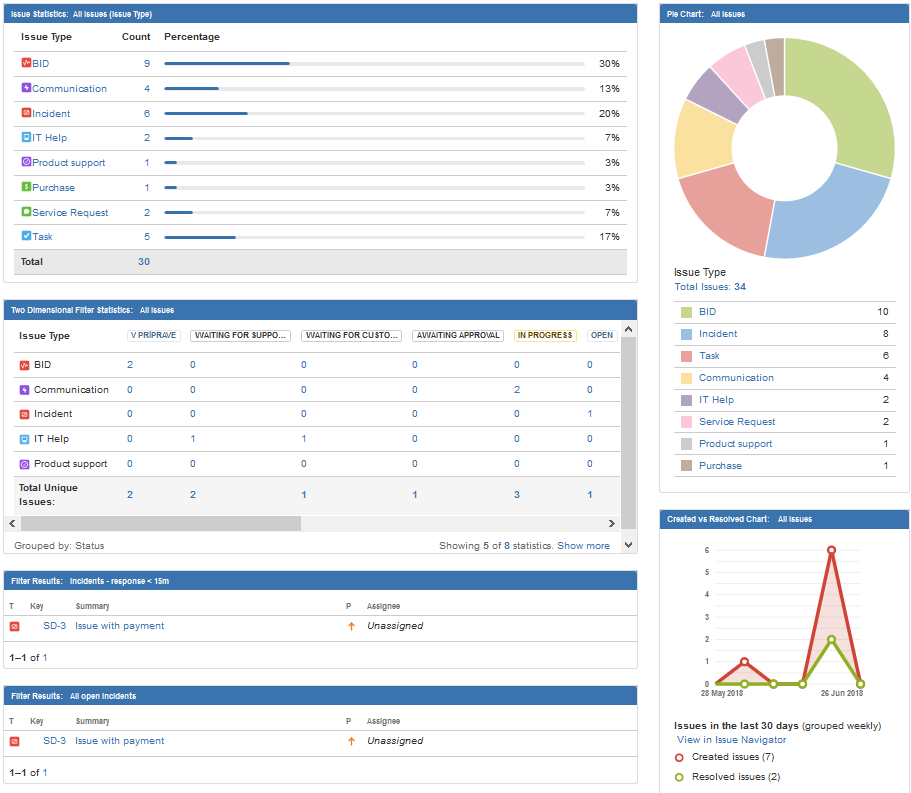
The user can preset and save multiple filters, which will then be displayed using gadgets on the Jira dashboard. Jira dashboards can be shared, i.e. certain groups of people can get different views than other users, of the same, consistent data. A dashboard can be complex, combining many gadgets, perhaps with a single summary chart-suitable for team leaders and workers. Or they can be simple, perhaps with just the summary chart, suitable for managers who want a quick overview of different teams.
Jira dashboardy sa využívajú v každodennej práci. Pre používateľov ponúkajú nenahraditeľný pohľad na aktuálne dáta v Jira. Zvyčajne tu získajú prehľad o úlohách, ktoré sú im priradené, na ktorých musia pracovať a treba ich splniť do určitého dátumu.

An example of a Jira dashboard depicting multiple Jira filters using different Jira gadgets
Jira dashboards are used in everyday work, offering a complete view of the current Jira data. This allows users to get an overview of the tasks assigned to them, and by which date the tasks must be completed.
A detailed description of all available Jira gadgets, description of Jira Filters or Jira Dashboard creation far exceeds the possible content of this blog post. We have touched only the tip of the iceberg.
 Are you interested in reporting opportunities in Jira? Would you like to know more? Do not hesitate to contact us.
Samuel Titka
Atlassian consultant
Our Atlassian solutions

